Grafana でディスク使用量の時系列グラフを眺めていて、ディスク使用率が一定の閾値を超えたかどうか知りたい。
Thresholds という機能を使うと、グラフに線を重ねて引ける。
1. パネル名をクリック→Edit をクリック

2. 右側の設定の一番下までスクロールして Thresholds を追加する
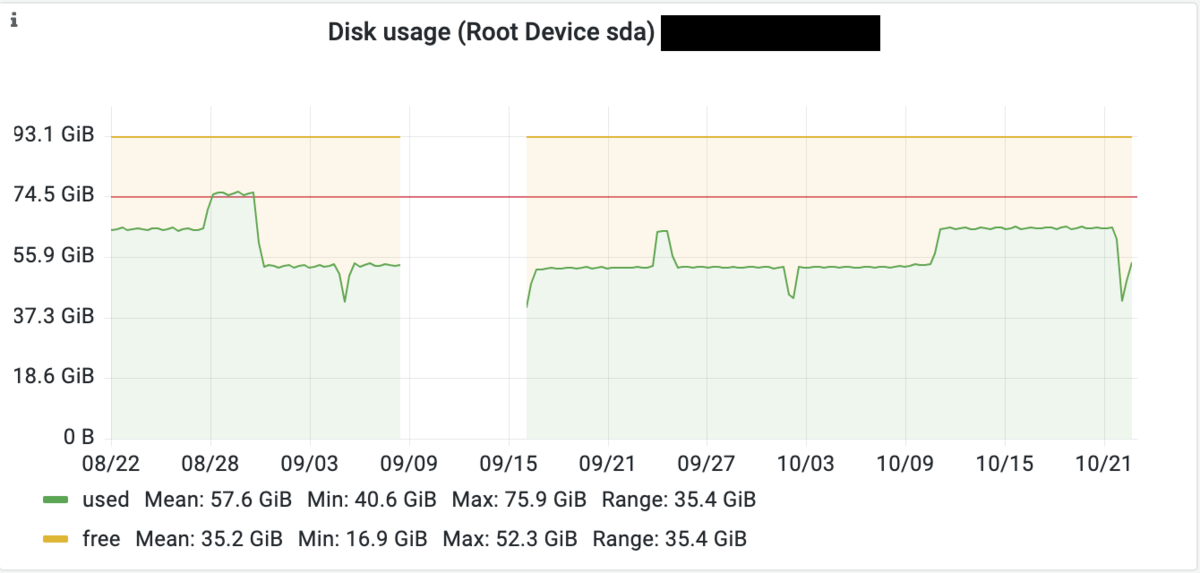
例: Thresholds mode = Percentage, Show thresholds = As lines で 80% の位置に赤い線を引く

3. グラフに線が引かれる
Grafana でディスク使用量の時系列グラフを眺めていて、ディスク使用率が一定の閾値を超えたかどうか知りたい。
Thresholds という機能を使うと、グラフに線を重ねて引ける。
例: Thresholds mode = Percentage, Show thresholds = As lines で 80% の位置に赤い線を引く